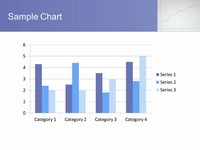
This educational template shows a graph or line chart.
A line chart is a two-dimensional scatterplot of ordered observations where the observations are connected following their order. It would be great for educational presentations or maths projects.


If you liked this PowerPoint Template we would appreciate you liking it on FaceBook or Tweeting it.


